Due to trouble in a project with long GC pauses, I just had myself a deeper look into GC details. There is not that much acessible information/benchmarks on the Web, so I thought I might share my tests and enlightments ^^. Last time I tested GC some years ago I just came to the conclusion, that allocation of any form is evil in Java and avoided it as far as possible in my code.
I will not describe the exact algorithms here as there is plenty of material regarding this. Understanding the algorithms in detail does not necessary help on predicting actual behaviour in real systems, so I will do some tests and benchmarks.
.
. I will cover GC from an empirical point of view here.
The basic idea of multi generational Garbage Collection is, to collect newer ("younger") Objects more frequent using a "minor" (short duration/pause) Collection algorithm. Objects which survived one or more minor collections then move to the "OldSpace". The OldSpace is garbage collected by the "major" Garbage Collector. I will name them NewSpace and NewGC, OldSpace and OldGC.
The NewGC Algorithm is pretty much the same amongst the 3 Garbage Collectors HotSpot provides. The Old Generation Collector ("OldGC") makes the difference.
Note that the term "parallel GC" refers to collection algorithms which run multithreaded, not necessary in parallel to your application.
I wrote a small program which emulates most of the stuff Garbage Collectors have problems with:
Note that this benchmark has an insane allocation rate and object age distribution. So results and VM tuning evaluated in this post illustrate the effects of some GC settings, its not cut & paste stuff, most of the sizings used to get this allocation greedy benchmark to work are way to big for real world applications.
Running the benchmark with -Xms8g -Xmx8g (the bench consumes 4g static, ~1g dynamic data) yields to quite disgusting results:
Each of the spikes represents a full GC with a duration of ~15 seconds ! During the full GC, the program is stopped. One can see, that the Garbage Collecor has some automatic calibration. Initially it did a pretty good job, but after first GC things get really bad.
I've noticed this in several tests. Most of the time the automatic calibration improves things, but sometimes it's vice versa (see Enlightment #2).
Hiccups ( [interval in milliseconds] => number of occurences ).
Iterations 9324, -Xmx8g -Xms8g
[0] 4930
[1] 4366
[2] 8
[7] 1
[14000] 1
[15000] 10
[16000] 4
[17000] 3
[18000] 1
Read like e.g '4930' requests done in 0 ms, 10 requests had a response time of 15 seconds. Throughput was 9324 requests.
CMS did somewhat better, however there were also severe program-stopping GC's. Note the >10 times higher throughput.
Iterations 115726, ‐XX:+UseConcMarkSweepGC -Xmx8g -Xms8g
[0] 52348
[1] 62317
[2] 157
[46] 7
[61] 13
[62] 127
[63] 234
[64] 164
[65] 81
[66] 55
[67] 45
[68] 42
[69] 25
[70] 28
[71] 16
[72] 11
[73] 5
[74] 12
[14000] 7
[15000] 4
[17000] 1
G1 does the best job here (still 10 inacceptable full stop GC's..)
Iterations 110052
[0] 37681
[1] 67201
[2] 1981
[3] 725
[4] 465
[5] 306
[6] 217
[7] 182
[8] 113
[9] 105
[39] 13 (skipped some intervals of minor occurence count)
[100] 288
[200] 23
[300] 6
[1000] 11
[12000] 5
[13000] 5
Hm .. pretty bad. Now, let's have a look into the GC internals:

If OldSpace (big green one) is full, the application gets a full-stop GC. In order to avoid Full GC, we need to reduce the promotion rate to OldSpace. An object gets promoted if it is alive (aka referenced) for a longer time than NewSpace (=Eden+Survivor Spaces) holds it.
So time for
Finding #1:
It is key to reduce the promotion rate from young gen to OldSpace. The promotion rate to OldSpace needs to be lowered in order to avoid Full-GC's. In case of concurrent OldSpace GC (CMS,G1), this will enable collectors to keep up with allocation rate.
Tuning the Young Generation
All 3 Collectors avaiable in Java 7 will profit of a proper NewGC setup.
Promotion happens if:
- The "survivor space" (S0, S1) is full.
The size of Survivor vs Eden is specified with the -XX:SurvivorRatio=N. A large Eden will increase throughput (usually) and will catch ultra-short lived temporary Objects better. However large Eden means small Survivor Spaces, so middle aged Objects might get promoted too quickly to OldSpace then, putting load on OldSpace GC.
- Survivors have survived more than -XX:MaxTenuringThreshold=N (Default 15) minor collections. Unfortunately I did not find an option to give a lower bound for this value, so one can specify a maximum here only. -XX:InitialTenuringThreshold might help, however I found the VM will choose lower values anyway in case.
The following actions will reduce promotion (by encouraging survivors to live longer in young generation)
- Decreasing -XX:SurvivorRatio=N to lower values than 8 (this actually increases the size of survivor spaces and decreases Eden size).
Effect is that survivors will stay for a longer time in young gen (if there is sufficient size)
This will reduce throughput as survivors are copied with each minor GC between S0,S1.
- Increase the overall size of young generation with -XX:NewRatio=N.
"1" means, young generation will use 50% of your heap, 2 means it will use 33% etc. A larger young gen reduces heap size for long-lived objects but will reduce the number of minor GCs and increase the size avaiable for survivors.
- Increase -XX:MaxTenuringThreshold=N to values > 15.
Of course this only reduces promotion, if the survivor space is large enough. Additonally this is only an upper bound, so the VM might choose a lower value regardless of your setting (you can also try -XX:InitialTenuringThreshold).
- Increasing overall VM heap will help (in fact more GB always help :-) ), as this will increase young generation (Eden+Survivor) and OldSpace size. An increase in OldSpace size reduces the number of required major GC's (or give concurrent OldSpace collectors more headroom to complete a major GC concurrent, pauseless).
It depends on the allocation behaviour of your application which of this actions will have effect.
Finding #2:
When adjusting Survivor Ratio and/or MaxTenuringThreshold manually, always switch off auto adjustment with
-XX:-UseAdaptiveSizePolicy
Below the effects of NewSpace settings on memory sizing. Note that the sizing of NewSpace directly reduces avaiable space in OldSpace So if your application holds a lot of statically allocated data, increasing size of young generation might require you to increase overall memory size.
Note: In practice one would evaluate the required size of NewSpace and specify it with -XX:NewSize=X -XX:MaxNewSize=X absolutely. This way changing -Xmx will affect OldSpace size only and will not mess up absolute Survivor Space sizes by applying ratios.
Actually the Default GC is the most useful collector to use in order to profile NewSpace setup, since there is no 2cnd background collector bluring OldSpace growth.
Survivor Sizing
The most important thing is, to figure out a good sizing (absolute, not ratio) for the survivor spaces and the promotion counter (MaxTenuringThreshold). Unfortunately there is a strong interaction between Eden size and MaxTenuringThreshold: If Eden is small, then Objects are put into survivor spaces faster, additional the tenuring counter is incremented more quickly. This means if Eden is doubled in size, you probably want to decrease your MaxTenuringThreshold and vice versa. This gets even more complicated as the number of Eden GC (=minor GC) also depends on application allocation rate.
The optimal survivor size is large enough to hold middle lived Objects under full application load without promoting them due to size shortage.
- If survivor space is too large, its just a waste of memory which could be given to Eden instead. Additionally there is a correlation between survivor size and minor GC pauses (throughput degradation, jitter) [Fixme: to be proven].
- If survivor space is too small, Objects will be promoted to OldSpace too early even if TenuringThreshold is not reached yet.
MaxTenuringThreshold
This defines how many minor GC's an Object may survive in SurvivorSpace before getting tenured to OldSpace. Again you have to optimize this under max application load, as without load there are fewer minor GC's so the "survived"-counters will be lower. Another issue to think of is that Eden size also affects the frequency of minor GC's. The VM will handle your value as an upper bound only and will automatically use lower values if it thinks these are more appropriate.
- If MaxTenuringThreshold is too high, throughput might suffer, as non-temporary Objects will be subject to minor collection which slows down application. As said, the VM automatically corrects that.
- If MaxTenuringThreshold is too low, temporary Objects might get promoted to OldSpace too early. This can hamper the OldSpace collector and increase the number of OldSpace GC's. If the promotion rate gets too high, even concurrent Collecors (CMS, G1) will do a full-stop-GC.
If in doubt, set MaxTenuringThreshold too high, this won't have a significant impact on application performance in practice.
It also strongly depends on the coding quality of the application: if you are the kind of guy preferring zero allocation programming, even a MaxTenuringThreshold=0 might be adequate (there is also kind of "alwaysTenure" option). The other extreme is "return new HashBuilder().computeHash(this);"-style (some alternative VM language produce lots of short to mid-lived temporary Garbage) where a settings like '30' or higher (which most often means: keep survivors as long there is room in SurvivorSpace) might be required.
Common sign of too slow promotion (MaxTenuringThreshold too high, Survivor size too high):
(
-Xmx12g -Xms12g -XX:-UseAdaptiveSizePolicy -XX:SurvivorRatio=3 -XX:NewRatio=2 -XX:MaxTenuringThreshold=20)
bad survivor, TenuringThreshold setting
Initially it looks like there are no Objects promoted to OldSpace, as they actually "sit" in Survivor Space. Once the survivor spaces get filled, survivors are tenured to old Space resulting in a sudden increase of promotion rate. (5 minute chart of benchmark running with default GC, actually the application does not allocate more memory, it just constantly replaces small fractions of initially allocated pseudo-static Objects). This will probably confuse concurrent OldSpace Collectors, as they will start concurrent collection too late. Beware: Clever project manager's might bug you to look for memory leaks in your application or to plow through the logs to find out "what happened 14:36 when memory consumption all over a sudden starts to rise".
Same benchmark with better settings (-Xmx12g -Xms12g -XX:-UseAdaptiveSizePolicy -XX:SurvivorRatio=4 -XX:NewSize=4g -XX:MaxNewSize=4g -XX:MaxTenuringThreshold=15):
better survivor, TenuringThreshold setting
The promotion rate now reflects the actual allocation rate of long-lived objects. Since there is no concurrent OldSpace Collector in the default GC, it looks like a permanent growth. Once the limit is reached, a Full-GC will be triggered and will clean up unused long lived Objects. A concurrent collector like CMS, G1 will now be able to detect promotion rate and keep up with it.
Eden Size
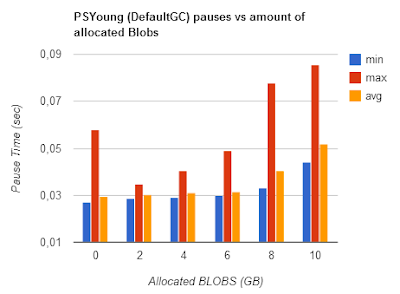
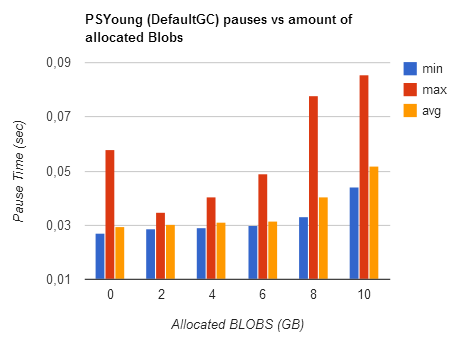
Eden Size directly correlates with throughput as most java applications will create a lot of temporary objects.
as measured with high allocation rate application
Eden size: red: 642MB, blue: 1,88GB, yellow: 3,13GB, green: 4,39GB
As one can see, Eden size correlates with number, not the length of minor collections.
Settings used for benchmark (Survivor spaces are kept constant, only Eden is enlarged):
-XX:-UseAdaptiveSizePolicy -XX:SurvivorRatio=1 -XX:NewSize=1926m -XX:MaxNewSize=1926m -XX:MaxTenuringThreshold=40
= 642m Eden
-XX:-UseAdaptiveSizePolicy -XX:SurvivorRatio=3 -XX:NewSize=3210m -XX:MaxNewSize=3210m -XX:MaxTenuringThreshold=15
= 1,88g Eden
-XX:-UseAdaptiveSizePolicy -XX:SurvivorRatio=5 -XX:NewSize=4494m -XX:MaxNewSize=4494m -XX:MaxTenuringThreshold=12
= 3,13g Eden
-XX:-UseAdaptiveSizePolicy -XX:SurvivorRatio=7 -XX:NewSize=5778m -XX:MaxNewSize=5778m -XX:MaxTenuringThreshold=8
= 4,39g Eden (heap size 14Gb required)
Finding #3:
- Eden size strongly correlates with throughput/performance for common java applications (with common allocation patterns). The difference can be massive.
- Eden size, Allocation rate, Survivor size and TenuringThreshold are interdependent. If one of those factors is modified, the others need readjustment
- Ratio-based options can be dangerous and lead to false assumptions. NewSpace size should be specified using absolute settings (-XX:NewSize=)
- Wrong sizing can lead to strange allocation and memory consumption patterns
Tuning OldSpace Garbage Collectors
Default GC
Default GC has a Full-Stop-GC (>15 seconds with the benchmark), so there is not much to do. If you want to run your application with Default GC (e.g. because of high throughput requirements), your only choice is to tune NewSpace GC very agressively, then throw tons of Heap to your application in order to avoid Full-GC during the day. If your system is 24x7 consider triggering a full GC using System.gc() at night if you expect the system load to be low.
Another possibility would be to even size the VM bigger than your physical RAM, so tenured Objects are written to swap disk. However you have to be sure then no Full-GC is triggered ever, because duration of Full-GC will go into the minutes then. I have not tried this.
Ofc one can improve things always by coding less memory intensive, however this is not the topic of this post.
Concurrent Mark & Sweep (CMS)
The CMS Collector does a pretty good job as long your promotion rate is not too high (which should not be the case if you optimized that as described above).
One Key setting of CMS Collector is, when to trigger a concurrent full GC. If it is triggered too late, it might not be able to finish in time and a Full-Stop-GC will happen. If you know your application has like 30% statically allocated data you might want to set this to 30% like -XX:+UseCMSInitiatingOccupancyOnly
-XX:CMSInitiatingOccupancyFraction=30. In practice I always start with a value of 0, then experiment with higher values once everything (NewSpace, OldSpace) is calibrated to operate without triggering FullGC under load.
When i copy the settings evaluated in the "NewGen Tuning" settings straight forward, the result will be a permanent Full-GC. Why ?
Because CMS requires more heap than the default GC. It seems like the same data structures just require ~20-30% more memory. So we just have to multiply NewGC settings evaluated from Default GC with 1.3.
Additionally, a good start is to let the concurrent Mark & Sweep run all the time.
So I go with (copied 2cnd NewSpace config from above and multiplied):
‐XX:+UseConcMarkSweepGC -XX:+UseCMSInitiatingOccupancyOnly
-XX:CMSInitiatingOccupancyFraction=10 -Xmx12g -Xms12g -XX:-UseAdaptiveSizePolicy
-XX:SurvivorRatio=3 -XX:NewSize=4173m -XX:MaxNewSize=4173m
-XX:MaxTenuringThreshold=15
The CMS is barely able to keep up with promotion rate, throughput is 300.000 which is acceptable given that cost of (in contradiction to tests above) Full-GC is included.
CMS OldSpace collection can keep up with promotion rate barely
We can see from Visual GC (an excellent jVisualVM plugin), that OldSpace size is on the edge of triggering a full GC. In order to improve throughput, we would like to increase eden. Unfortunately there is not enough headroom in OldSpace, as a reduction of OldSpace would trigger Full-Stop-GC's.
Reducing the size of Surviver Spaces is not an option, as this would result in a higher tenured Object rate and again trigger Full GC's. The only solution is: More Memory.
Comparing throughput with the Default GC test above is not fair, as the Default GC would run into Full-Stop-GC's for sure, if the test would run for a longer time than 5 minutes.
On a side note: the memory chart of jVisual VM's (and printouts by -verbose:gc) does not tell you the full story as you cannot see the fraction of used memory in OldSpace.
Ok, so lets add 2 more Gb to be able to increase eden resulting in
-XX:+UseConcMarkSweepGC -XX:+UseCMSInitiatingOccupancyOnly
-XX:CMSInitiatingOccupancyFraction=10 -Xmx14g -Xms14g -XX:-UseAdaptiveSizePolicy
-XX:SurvivorRatio=4 -XX:NewSize=5004m -XX:MaxNewSize=5004m
-XX:MaxTenuringThreshold=15
(Eden size is 3,25 GB).
This increases throughput by 10% to 330.000.
blue is Heap 12g, Eden 2,4g, red is Heap 14g, Eden 3,2g
The longest pause noted in processing were 400ms. Exact Reponse time distribution:
-XX:+UseConcMarkSweepGC
-XX:+UseCMSInitiatingOccupancyOnly -XX:CMSInitiatingOccupancyFraction=10
-Xmx14g -Xms14g
-XX:-UseAdaptiveSizePolicy
-XX:SurvivorRatio=4 -XX:NewSize=5004m -XX:MaxNewSize=5004m
-XX:MaxTenuringThreshold=15
Iterations 327175
[0] 146321
[1] 179968
[2] 432
[3] 33
[14] 1
[70] 2
[82] 1
[83] 1
[85] 2
[87] 1
[100] 3
[200] 355
[300] 44
[400] 11
Finding #4:
- Eden size still correlates with throughput for CMS
- Compared with the Default Hotspot GC all NewGen sizes must be multiplied by 1.3
- CMS also requires 20%-30% more Heap for identical data structures
- No Full-Stop-GCs at all if you can provide the necessary amount of memory (large NewSpace + HeadRoom in OldSpace)
The G1 Collector
The G1 collector is different. Each segment of G1 has its own NewSpace, so absolute values set with -XX:NewSize=5004m -XX:MaxNewSize=5004m are actually ignored (don't ask me how long i fiddled with G1 and the NewSize parameters until I got this). Additionally VisualGC does not work for G1 Collector.
Anyway, we still know that the benchmark succeeds in being one of the most greedy java programs out there, so ..
- we like large survivor spaces and a large NewSpace to reduce promotion to OldSpace
- we like large Eden to trade memory efficiency against throughput. Memory is cheap.
Unfortunately not much is known about the efficiency of the G1 OldSpace collector, so the only possibility is testing. If the G1 OldSpace collector is more efficient than CMS OldSpace collector, we could decrease survivor space in favour of bigger eden spaces, because with a potentially more efficient G1 OldSpace collector, we may afford a higher promotion rate.
Here we go:
-Xmx12g -Xms12g -XX:+UseG1GC -XX:-UseAdaptiveSizePolicy -XX:SurvivorRatio=1 -XX:NewRatio=1 -XX:MaxTenuringThreshold=15
yields:
Iterations 249372
(values < 100ms skipped)
[100] 10
[200] 1
[400] 4
[500] 198
[600] 15
[700] 1
well, that's pretty good as first effort. Lets try to increase decrease survivors and start concurrent G1 earlier ..
-Xmx12g -Xms12g -XX:+UseG1GC -XX:-UseAdaptiveSizePolicy -XX:SurvivorRatio=2 -XX:NewRatio=1 -XX:MaxTenuringThreshold=15 -XX:InitiatingHeapOccupancyPercent=0
Iterations 233262
[100] 3
[200] 1
[400] 81
[500] 96
[600] 3
[700] 5
[800] 2
[1000] 18
err .. nope. We can see that decreasing survivor space puts more load on G1 OldSpace GC as the number of 1 second area pauses increased significantly. Just another blind shot relaxing survivors and increase G1 OldSpace load ..
-Xmx12g -Xms12g -XX:+UseG1GC -XX:-UseAdaptiveSizePolicy -XX:SurvivorRatio=6 -XX:NewRatio=1 -XX:MaxTenuringThreshold=15 -XX:InitiatingHeapOccupancyPercent=0
Iterations 253293
[100] 5
[200] 1
[400] 186
[500] 2
[600] 9
[700] 5
[1000] 16
same throughput as intial trial, but larger pauses .. so I still need to look for large survivor and eden space. The only way to influence absolute NewSpace size is changing segment size (I take max size ofc).
-Xmx12g -Xms12g -XX:+UseG1GC -XX:-UseAdaptiveSizePolicy -XX:SurvivorRatio=1 -XX:NewRatio=1 -XX:MaxTenuringThreshold=15 -XX:G1HeapRegionSize=32m
Iterations 275464
[100] 37
[300] 1
[400] 5
[500] 189
[600] 16
[900] 1
Bingo ! Unfortunately all known tuning options are exploited now .. except main Heap size ..
-Xmx14g -Xms14g -XX:+UseG1GC -XX:SurvivorRatio=1 -XX:NewRatio=1 -XX:MaxTenuringThreshold=15 -XX:-UseAdaptiveSizePolicy -XX:G1HeapRegionSize=32m
Iterations 296270
[100] 58
[200] 3
[300] 2
[400] 4
[500] 160
[600] 15
[700] 11
This is slightly worse in latency and througput than a proper configured CMS. One last shot in order to figure out behaviour regarding memory size constraints (at least real peak size of the bench is round 4.5g ... sigh):
-Xmx8g -Xms8g -XX:+UseG1GC -XX:SurvivorRatio=1 -XX:NewRatio=2 -XX:MaxTenuringThreshold=15 -XX:-UseAdaptiveSizePolicy -XX:G1HeapRegionSize=32m
Iterations 167721
[100] 37
[200] 1
[300] 3
[400] 297
[500] 7
[600] 9
[700] 5
[1000] 15
[2000] 1
It seems G1 excels in memory efficiency without having to do too long pauses (CMS falls into permanent full GC if I try to run the bench with 8g heap). This can be important in memory constrained server environments and at client side.
Finding #5:
- Absolute settings for NewSpace size are ignored by G1. Only the ratio based options are acknowledged.
- In order to influence eden/survivor space, one can increase/decreas segment size up to 32m. This also gave best throughput (possibly because of larger eden)
- G1 can handle memory constraints the best without extremely long pauses
- Latency distribution is ok, but behind CMS
Conclusion
Disclaimer:
- The benchmark used is worst case ever regarding allocation rate and memory waste. So take any finding with a grain of salt, when applying GC optimizations to your program.
- I did not drive long term tests. All tests ran for 5 minutes only. Due to the extreme allocation rate of the benchmark, 5 minute benchmark is likely aequivalent to an hour operation of a "real" program. Anyway in an application with lower allocation rate, concurrent collectors will have more time to complete GC's concurrent, so you probably never will need an eden size of 4Gb in practice :).
I will provide long term runs in a separate post (maybe :) ).
Default GC (Serial Mark&Sweep, Serial NewGC) shows highest throughput as long no Full GC is triggered.
If your system has to run for a limited amount of time (like 12 hours) and you are willing to invest into a very careful programming style regarding allocation; keep large datasets Off-Heap, DefaultGC can be the best choice. Of course there are applications which are ok with some long GC pauses here and there.
CMS does best in pause-free low latency operation as long you are willing to throw memory at it. Throughput is pretty good. Unfortunately it does not compact the heap, so fragmentation can be an issue over time. This is not covered here as it would require to run real application tests with many different Object sizes for several days. CMS is still way behind commercial low-latency solutions such as Azul's Zing VM.
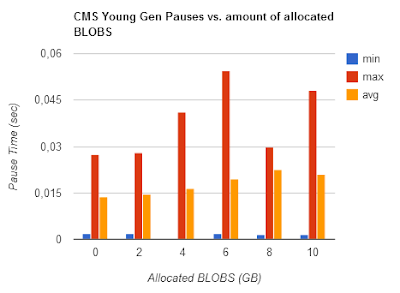
G1 excels in robustness, memory efficiency with acceptable throughput. While CMS and DefaultGC react to OldSpace overflow with Full-Stop-GC of several seconds up to minutes (depends on Heap size and Object graph complexity), G1 is more robust in handling those situations. Taking into account the benchmark represents a worst case scenario in allocation rate and programming style, the results are encouraging.
Blue:CMS, Red: Default GC, Yellow: G1
Note: G1 has the lowest number of pauses. (Default GC has been tweaked to not do >15 second Full GC during test duration)
Default GC has been tweaked to not Full GC during test duration
The Benchmark source
public class FSTGCMark {
static class UseLessWrapper {
Object wrapped;
UseLessWrapper(Object wrapped) {
this.wrapped = wrapped;
}
}
static HashMap map = new HashMap();
static int hmFillRange = 1000000 * 30; //
static int mutatingRange = 2000000; //
static int operationStep = 1000;
int operCount;
int milliDelayCount[] = new int[100];
int hundredMilliDelayCount[] = new int[100];
int secondDelayCount[] = new int[100];
Random rand = new Random(1000);
int stepCount = 0;
public void operateStep() {
stepCount++;
if ( stepCount%100 == 0 ) {
// enforce some tenuring
for ( int i = 0; i < operationStep; i++) {
int key = (int) (rand.nextDouble() * mutatingRange)+mutatingRange;
map.put(key, new UseLessWrapper(new UseLessWrapper(""+stepCount)));
}
}
if ( stepCount%200 == 199 ) {
// enforce some tenuring
for ( int i = 0; i < operationStep; i++) {
int key = (int) (rand.nextDouble() * mutatingRange)+mutatingRange*2;
map.put(key, new UseLessWrapper(new UseLessWrapper("a"+stepCount)));
}
}
if ( stepCount%400 == 299 ) {
// enforce some tenuring
for ( int i = 0; i < operationStep; i++) {
int key = (int) (rand.nextDouble() * mutatingRange)+mutatingRange*3;
map.put(key, new UseLessWrapper(new UseLessWrapper("a"+stepCount)));
}
}
if ( stepCount%1000 == 999 ) {
// enforce some tenuring
for ( int i = 0; i < operationStep; i++) {
int key = (int) (rand.nextDouble() * hmFillRange);
map.put(key, new UseLessWrapper(new UseLessWrapper("a"+stepCount)));
}
}
for ( int i = 0; i < operationStep/2; i++) {
int key = (int) (rand.nextDouble() * mutatingRange);
map.put(key, new UseLessWrapper(new Dimension(key,key)));
}
for ( int i = 0; i < operationStep/8; i++) {
int key = (int) (rand.nextDouble() * mutatingRange);
map.put(key, new UseLessWrapper(new UseLessWrapper(new UseLessWrapper(new UseLessWrapper(new UseLessWrapper("pok"+i))))));
}
for ( int i = 0; i < operationStep/16; i++) {
int key = (int) (rand.nextDouble() * mutatingRange);
map.put(key, new UseLessWrapper(new int[50]));
}
for ( int i = 0; i < operationStep/32; i++) {
int key = (int) (rand.nextDouble() * mutatingRange);
map.put(key, ""+new UseLessWrapper(new int[100]));
}
for ( int i = 0; i < operationStep/32; i++) {
int key = (int) (rand.nextDouble() * mutatingRange);
Object[] wrapped = new Object[100];
for (int j = 0; j < wrapped.length; j++) {
wrapped[j] = ""+j;
}
map.put(key, new UseLessWrapper(wrapped));
}
for ( int i = 0; i < operationStep/64; i++) {
int key = (int) (rand.nextDouble() * mutatingRange /64);
map.put(key, new UseLessWrapper(new int[1000]));
}
for ( int i = 0; i < 4; i++) {
int key = (int) (rand.nextDouble() * 16);
map.put(key, new UseLessWrapper(new byte[1000000]));
}
}
public void fillMap() {
for ( int i = 0; i < hmFillRange; i++) {
map.put(i, new UseLessWrapper(new UseLessWrapper(""+i)));
}
}
public void run() {
fillMap();
System.gc();
System.out.println("static alloc " + (Runtime.getRuntime().totalMemory() - Runtime.getRuntime().freeMemory()) / 1000 / 1000 + "mb");
long time = System.currentTimeMillis();
int count = 0;
while ( (System.currentTimeMillis()-time) < runtime) {
count++;
long tim = System.currentTimeMillis();
operateStep();
int dur = (int) (System.currentTimeMillis()-tim);
if ( dur < 100 )
milliDelayCount[dur]++;
else if ( dur < 10*100 )
hundredMilliDelayCount[dur/100]++;
else {
secondDelayCount[dur/1000]++;
}
}
System.out.println("Iterations "+count);
}
public void dumpResult() {
for (int i = 0; i < milliDelayCount.length; i++) {
int i1 = milliDelayCount[i];
if ( i1 > 0 ) {
System.out.println("["+i+"]\t"+i1);
}
}
for (int i = 0; i < hundredMilliDelayCount.length; i++) {
int i1 = hundredMilliDelayCount[i];
if ( i1 > 0 ) {
System.out.println("["+i*100+"]\t"+i1);
}
}
for (int i = 0; i < secondDelayCount.length; i++) {
int i1 = secondDelayCount[i];
if ( i1 > 0 ) {
System.out.println("["+i*1000+"]\t"+i1);
}
}
}
int runtime = 60000 * 5;
public static void main( String arg[] ) {
FSTGCMark fstgcMark = new FSTGCMark();
fstgcMark.run();
fstgcMark.dumpResult();
}
}