Saturday, December 21, 2013

Big Data the 'reactive' way

This has been posted (by me ofc) on the Java Advent Calendar originally. Check it  out for more interesting articles:

http://www.javaadvent.com/2013/12/big-data-reactive-way.html


A metatrend going on in the IT industry is a shift from query-based, batch oriented systems to (soft) realtime updated systems. While this is associated with financial trading only, there are many other examples such as "Just-In-Time"-logistic systems, flight companies doing realtime pricing of passenger seats based on demand and load, C2C auction system like EBay, real time traffic control and many more.

It is likely this trend will continue, as the (commercial) value of information is time dependent, value decreases with age of information.

Automated trading in the finance sector is just a forerunner in this area, because some microseconds time advantage can be worth millions of dollars. Its natural real time processing systems evolve in this domain faster.

However big parts of traditional IT infrastructure is not designed for reactive, event based systems. From query based databases to request-response based Http protcol, the common paradigm is to store and query data "when needed".

Current Databases are static and query-oriented


Current approaches to data management such as SQL and NOSQL databases focus on data transactions and static query of data. Databases provide convenience in slicing and dicing data but they do not support update of complex queries in real time. Uprising NOSQL databases still focus on computing a static result.
Databases are clearly not "reactive".

Current Messaging Products provide poor query/filtering options


Current messaging products are weak at filtering. Messages are separated into different streams (or topics), so clients can do a raw preselection on the data received. However this frequently means a client application receives like 10 times more data than needed, doing fine grained filtering 'on-top'.
A big disadvantage is, that the topic approach builts filter capabilities "into" the system's data design.
E.g. if a stock exchange system splits streams on a per-stock base, a client application still needs to subscribe to all streams in order to provide a dynamically updated list of "most active" stocks. Querying usually means "replay+search the complete message history".

A scalable, "continuous query" distributed Datagrid. 


I had the enjoyment to do conceptional & technical design for a large scale realtime system, so I'd like to share a generic scalable solution for continuous query processing at high volume and large scale.

It is common, that real-time processing systems are designed "event sourced". This means, persistence is replaced by journaling transactions. System state is kept in memory, the transaction journal is required for historic analysis and crash recovery only.
Client applications do not query, but listen to event streams instead. A common issue with event sourced systems is the problem of "late joining client". A late client would have to replay the whole system event journal in order to get an up-to-date snapshot of the system state.
In order to support late joining clients, a kind of "Last Value Cache" (LVC) component is required. The LVC holds current system state and allows late joiners to bootstrap by querying.
In a high performance, large data system, the LVC component becomes a bottleneck as the number of clients rises.

Generalizing the Last Value Cache: Continuous Queries


In a continuous query data cache, a query result is kept up to date automatically. Queries are replaced by subscriptions.
subscribe * from Orders where
   symbol in ['ALV', 'BMW'] and
   volume > 1000 and
   owner='MyCompany'
creates a message stream, which initially performs a query operation, after that updates the result set whenever a data change affecting the query result happened (transparent to the client application). The system ensures each subscriber receives exactly the change notifications necessary to keep its "live" query results up-to-date.


A distributed continous query system: The LVC Nodes hold data. Transactions are sent to them on a message bus (red). The LVC nodes compute the actual difference caused by a transaction and send change notifications on a message bus (blue).  This enables "processing nodes" to keep a mirror of their relevant data partition up-to-date. External clients connected via TCP/Http do not listen to the message bus (because multicast is not an option in WAN). "Subscription processors" keep the client's continuous queries up-to-date by listening to the (blue) message bus and dispatching required change notifications only to client's point2point connection.


Difference of data access patterns compared to static data management:


  • High write volume
    Real time systems create a high volume of write access/change in data.
  • Fewer full table scans.
    Only late-joining clients or changes of a query's condition require a full data scan. Because continuous queries make "refreshing" a query result obsolete, Read/Write ratio is ~ 1:1 (if one counts the change notification resulting from a transaction as "Read Access").
  • The majority of load is generated, when evaluating queries of active continuous subscriptions with each change of data. Consider a transaction load of 100.000 changes per second with 10.000 active continuous queries: this requires 100.000*10.000 = 1 Billion evaluations of query conditions per second. That's still an underestimation: When a record gets updated, it must be tested whether the record has matched a query condition before the update and whether it matches after the update. A record's update may result in an add (because it matches after the change) or a remove transaction (because the record does not match anymore after a change) to a query subscription.

Data Cluster Nodes ("LastValueCache Nodes")

Data is organized in tables, column oriented. Each table's data is evenly partitioned amongst all data grid nodes (=last value cache node="LVC node"). By adding data nodes to the cluster, capacity is increased and snapshot queries (initializing a subscription) are sped up by increased concurrency.

There are three basic transactions/messages processed by the data grid nodes:

  • AddRow(table,newRow), 
  • RemoveRow(table,rowId), 
  • UpdateRow(table, rowId, diff). 

The data grid nodes provide a lambda-alike (row iterator) interface supporting the iteration of a table's rows  using plain java code. This can be used to perform map-reduce jobs and as a specialization, the initial query required by newly subscribing clients. Since ongoing computation of continuous queries is done in the "Gateway" nodes, the load of data nodes and the number of clients correlate weakly only.

All transactions processed by a data grid node are (re-)broadcasted using multicast "Change Notification" messages.

Gateway Nodes


Gateway nodes track subscriptions/connections to client applications. They listen to the global stream of change notifications and check whether a change influences the result of a continuous query (=subscription). This is very CPU intensive.

Two things make this work:

  1. by using plain java to define a query, query conditions profit from JIT compilation, no need to parse and interpret a query language. HotSpot is one of the best optimizing JIT compilers on the planet.
  2. Since multicast is used for the stream of global changes, one can add additional Gateway nodes with ~no impact on throughput of the cluster.

Processor (or Mutator) Nodes


These nodes implement logic on-top of the cluster data. E.g. a statistics processor does a continuous query for each table, incrementally counts the number of rows of each table and writes the results back to a "statistics" table, so a monitoring client application can subscribe to realtime data of current table sizes. Another example would be a "Matcher processor" in a stock exchange, listening to orders for a stock, if orders match, it removes them and adds a Trade to the "trades" table.
If one sees the whole cluster as kind of a "giant spreadsheet", processors implement the formulas of this spreadsheet.

Scaling Out


  • with data size:
    increase number of LVC nodes
  • Number of Clients
    increase subscription processor nodes.
  • TP/S
    scale up processor nodes and LVC nodes
Of cause the system relies heavily on availability of a "real" multicast messaging bus system. Any point to point oriented or broker-oriented networking/messaging will be a massive bottleneck.


Conclusion


Building real time processing software backed by a continuous query system simplifies application development a lot.
  • Its model-view-controller at large scale.
    Astonishing: patterns used in GUI applications for decades have not been extended regulary to the backing data storage systems.
  • Any server side processing can be partitioned in a natural way. A processor node creates an in-memory mirror of its data partition using continuous queries. Processing results are streamed back to the data grid. Computing intensive jobs, e.g. risk computation of derivatives can be scaled by adding processor instances subscribing to distinct partitions of the data ("sharding").
  • The size of the Code Base reduces significantly (both business logic and Front-End).
    A lot of code in handcrafted systems deals with keeping data up to date.

About me

I am a technical architect/senior developer consultant at an european company involved heavily in stock & derivative trading systems.


This post is part of the Java Advent Calendar and is licensed under the Creative Commons 3.0 Attribution license. If you like it, please spread the word by sharing, tweeting, FB, G+ and so on!

Sunday, December 15, 2013

Dart - a possible solution to the high.cost@lowquality.webapp syndrome

I am involved in development of high quality real time middle ware/GUI front-end applications professionally. Up to now, we were forced to use traditional Fat Client/Server designs, as Web Applications fail to fulfil basic usability requirements (e.g. Key Shortcuts) and performance requirement (high frequency real time updates). Basic UI features often require nasty and unmaintainable JavaScript hacks (the awkward, unfunful kind of hack) which blow up development+testing cost.

Regarding user experience/performance, checkout this example of a (good!) server centric framework:

(no offence, Apache-Wicket is one of the best Web-Frameworks out there IMO).
  • its sluggish
  • can't navigate with arrow keys
  • no standard multi selection (with Ctrl, Shift etc.)
if we go down the JavaScript route, we can do better:
http://www.jqwidgets.com/jquery-widgets-demo/demos/jqxgrid/index.htm?(arctic)#demos/jqxgrid/filtering.htm

However (having fiddled with JS myself) its suspicious: one can't resize any of the demo tables. Googling results in the following finding:

The Grid widget works with fixed width only which is specified by its ‘width’ property. It is not possible to set its width in percentages in this version. We’ll implement the requested feature for a future version. 
Best Regards, XXXX, DevTeam

So by the end of year 2013, it is still a problem to achieve basic UI functionality with current web standards and browsers. Even worse, it fails to respect basic software engineering principles such as DRY (don't repeat yourself), encapsulation, ..
(check out the "source" tab of the link above to get an impression of the mess required to create a simple table demo component).

This is not the fault of the libraries mentioned above, the root cause of this mess are the underlying half baked W3C "standards" (+ browser implementations). They are apparently defined by people never involved in real world application development.

So we sit there with an intact hype, but without a productive development stack to fulfil the vision. Since management tends to share the hype but does not validate technical feasibility, this led to some prominent mis-decisions such as Steve Jobs claiming WebApps can be used on the iPhone instead of native apps (first iPhone release had no native APIs), another example is facebook relying on html5 too much, now moving back to native phone apps hastily.

Following I'll explain why I think we urgently need the paradigm shift in Web-Applications. Without a fundamental change, industry will keep burning money trying to build WebApplications based on expensive , crappy, half-baked technology.

In the beginning there was REST

and it sucked right away ..

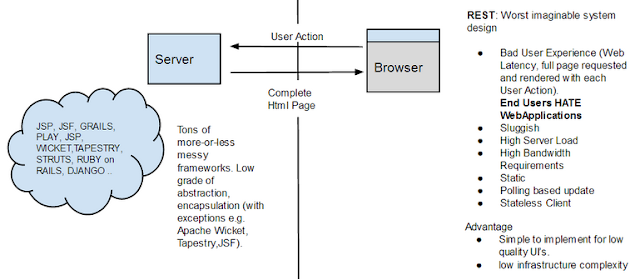
The use of the REST (Representational State Transfer) design pattern results in

  • the absence of state in a server application.
    Any durable client state gets passed with each request of a client. 
  • each user interaction (e.g. click a button) requires a complete html document served, transmitted and rendered. 
  • no concept of a "connection" at HTTP-protocol level,
    so authentication and security related stuff (e.g. SSL handshake) has to be repeated with each request/response (=change of GUI state). 

This allowed WebGUIs to max out on bandwidth inefficiency and latency. It also leads to usability nuggets by losing subtle GUI state (such as scrollbar position or the longish forum post you started to write).


JavaScript, Ajax and "Look ma, a menu in the browser"

Innovation (& browser wars) never sleep. Industry leading companies and consortium's figured out, that the best way to address fundamental design issues is to provide many many many workarounds on top of it.

Examples:
  • Http Keep alive to reduce latency
  • Standardize on an untyped weirdish scripting language,
    which can be cluttered all across the html page in tiny snippets. Ah .. there is nothing like mixing program, content and styling into a big code soup ..
  • Content Caching (man we had fun doing software updates ..)
    to avoid superfluous reload of static content
  • Define new Html Tags. A lot of them.
    The advantage of having many html tags is, that browsers have more room to implement them differently, allowing for the popular "if ( ie6 ) {...........} else if (mozilla) .. else if (safari) .." coding style. This way bandwidth requirements could be extended even more.
  • CSS was embraced,
    so when done with definition of new tags, they could continue with definition of new css attributes. Also javascript could mess up even better modifying the HTML DOM and CSS definitions at runtime.
  • Async Http Request (AJAX)
    avoids the need to reload whole html-page.
These are kludges (some of them with notable negative side effects) addressing fundamental issues of an overly simplistic foundation technology. So we got, what I call the MESS technology stack:

The MESS principles also infiltrated server side frameworks, as they had to deal with the MESS somehow. I'd speculate some of the frameworks are 90% "mess-handlers', designed to virtualize a solid engineered foundation in order to increase productivity when messing with the MESS.

Google to the rescue !!

One can safely assume apple and microsoft are not *that* interested in providing a fluid web application platform. If all applications would be WebApplications, the importance of the underlying operation system dwindles. All a user needs, is a compliant browser (hello Chrome OS).

Google as a major web application implementor/provider suffer them self from the high.cost@low-quality.webapp syndrome.

Some clever JavaScript hackers (<= positive) started to figure out a simplified, more flexible web application design. They basically implemented a "Fat Client" in JavaScript. Instead of doing page-reloading Http requests, they used Async Http to retrieve data from the server and rendered this data by modifying parts of the displayed html document (via DOM). Whenever you see a responsive 'cool' web application, you can safely assume it relies on this approach.

However JavaScript is not designed to work well at large business applications with many lines of code and fluctuation of development staff as typical for enterprise software development. It becomes a maintenance nightmare for sure (if the project succeeds at all) or a minimalistic solution hated by end-users.

The first widely known step in backing up the hype with a structured technology was the Google Widget Toolkit, which relied on compiling ("transpiling") java to browser compatible JavaScript.
For various reasons, this project has been stalled (but not dropped) by Google in favour of their new Dart language before the technology reached a 'mature' state. It has been reported that turn-around times get unacceptable with larger applications and its unlikely this will change (because resources have been moved to Dart). Remembering the law suit of Oracle against use of Java in Android, this move of Google is not too surprising.

Dart has the potential to reach a level of convenience which has been there for native apps for years:

  • extensive API to the browser. Anything achievable with JavaScript can be done with Dart.
  • a modern structured language with (optional) compile time type checking, a package concept and support for many well-known principles of object oriented programming like Classes, Interfaces (Mixins), Inheritance, Lambdas. The concurrency model of Dart (Isolates, similar to Actors) could be interesting on the server side also.
  • compilable to JavaScript
  • support for fully encapsulated tag-based UI components (via polymer lib and upcoming WebComponents w3c standard)
  • backed by a company providing the worlds leading browser and a believable self-dependency on the technology.

Conclusion

Mankind not only is capable to build chips with 800 million transistors, it also might be capable creating standards defined by 800 million words .. scary ;-) .

What about Java ?

Update: Back2Brwsr and TeaVM are projects based on Java=>JS transpiling.

While the Scala guys join the party late http://www.scala-lang.org/news/2013/11/29/announcing-scala-js-v0.1.html, Oracle misses the train and seems to favour JavaFX as a GUI platform (my prediction: Will fall asleep prior to reaching maturity).
GWT has been open sourced, so maybe the community will do further development. Given that there are more open source projects than developers willing to contribute, I doubt this will be able to keep pace with Google's money backed Dart. Also I could imagine the (aging) Java community shys away from (partially) deprecating their habitual server side framework landscape.

There is also http://qooxdoo.org/contrib/project/qwt/about/java backed by a bigger german hosting company. I have not tested this, but I doubt that pure community driven development will keep pace. Being compliant to ever changing draft specs and dealing with browser implementation variance is not fun ...

What's required is a byte-code to JavaScript transpiler. 
The browser API (DOM access) could be modeled by a set of interfaces at compile time and replaced by the transpiler with the appropriate javascript calls. 
Using static bytecode analysis or by tracking required classes at runtime, the set of required transpiled classes/methods could be found. Additionally one would need a fall-back transpiler at runtime. If a client side script instantiates an "un-transpiled" java class or method, it could be transpiled on-the-fly at server side and loaded to the client.
Nice thing of such a bytecode level transpiler would be, that all VM-based languages (groovy, scala, jruby, jphyton, ..) could profit from such a system. 
Example of a possible Java2JavaScript transpiling solution: Since Java is a wide spread server platform, a java2js transpiler could work dynamically, which is a major strategic advantage over Dart, which needs to use static analysis & compilation because most server systems are not running native dart.

There needs to be put real money on such a Java solution, with slow moving JCP we probably can expect something like this 2016 or later ...
Would be fun building such a transpiler system .. but no time - gotta mess with the MESS.

Update: The J2EE java 8 project seems to adapt to new 'thin' webapp architecture with project "Avatar". I still haven't figured out the details. On a first glance it looks like they bring JS to the server instead of bringing Java transpilation to the client .. which is a mad idea imho :-).

Update on GWT: A google engineer answered back on GWT telling me the project is alive and is in active development. It turns out Dart and GWT are handled by distinct (competing?) divisions of google. There still is evidence, that Dart receives the real money while GWT is handed over to the community. Google plans to bring native DartVM to chrome within ~1 year (rumours) and plans on delivering the DartVM to Android also.


Saturday, October 12, 2013

Still using Externalizable to get faster Serialization with Java ?


Update: When turning off detection of cycles, performance can be improved even further (FSTConfiguration.setUnshared(true)). However in this mode an object referenced twice is written twice.

According to popular belief, the only way to go is handcrafted implementation of the Externalizable interface in order to get fast Java Object serialization.

Manual coding of "readExternal" and "writeExternal" methods is an errorprone and boring task. Additionally, with each change of a class's fields, the externalizable methods need adaption.

In contradiction to popular belief, a good implementation of generic serialization can be faster than handcrafted implementation of the Externalizable interface 99% if not 100% of the time.

Fortunately I managed to save the world with the fast-serialization library by addressing the disadvantages of Serialization vs Externalizable.

The Benchmark

The following class will be benchmarked.
public class BlogBench implements Serializable {
    public BlogBench(int index) {
        // avoid benchmarking identity references instead of StringPerf
        str = "Some Value "+index;
        str1 = "Very Other Value "+index;
        switch (index%3) {
            case 0: str2 = "Default Value"; break;
            case 1: str2 = "Other Default Value"; break;
            case 2: str2 = "Non-Default Value "+index; break;
        }
    }
    private String str;
    private String str1;
    private String str2;
    private boolean b0 = true;
    private boolean b1 = false;
    private boolean b2 = true;
    private int test1 = 123456;
    private int test2 = 234234;
    private int test3 = 456456;
    private int test4 = -234234344;
    private int test5 = -1;
    private int test6 = 0;
    private long l1 = -38457359987788345l;
    private long l2 = 0l;
    private double d = 122.33;
}
To implement Externalizable, a copy of the class above is made but with Externalizable implementation
(source is here).
The main loop for fast-serialization is identical, I just replace "ObjectOutputStream" with "FSTObjectOutput" and "ObjectInputStream" with "FSTObjectInput".
Result:

  • Externalizable performance with JDK-Serialization is much better compared to Serializable
  • FST manages to serialize faster than manually written "read/writeExternal' implementation

Size is 319 bytes for JDK Serializable, 205 for JDK Externalizable, 160 for FST Serialization. Pretty big gain for a search/replace operation vs handcrafted coding ;-). BTW if the "Externalizable" class is serialized with FST it is still slightly slower than letting FST do generic serialization.

There is still room for improvement ..

The test class is rather small, so setup + allocation of the Input and Output streams take a significant part on the times measured. Fortunately FST provides mechanisms to reuse both FSTObjectInput and FSTObjectOutput. This yields ~200ns better read and write times.

So "new FSTObjectOutput(inputStream)" is replaced with
FSTConfiguration fstConf = FSTConfiguration.getDefaultConfiguration();
...
fstConf.getObjectOutput(bout)
There is even more improvement ..

Since Externalizable does not need to track references and this is not required for the test class, we turn off reference tracking for our sample by using the @Flat annotation. We can also make use of the fact, "str3" is most likely to contain a default value ..

@Flat
public class BlogBenchAnnotated  implements Serializable {
    public BlogBenchAnnotated(int index) {
        // avoid benchmarking identity references instead of StringPerf
        str = "Some Value "+index;
        str1 = "Very Other Value "+index;
        switch (index%3) {
            case 0: str2 = "Default Value"; break;
            case 1: str2 = "Other Default Value"; break;
            case 2: str2 = "Non-Default Value "+index; break;
        }
    }
    @Flat private String str;
    @Flat private String str1;
    @OneOf({"Default Value","Other Default Value"})
    @Flat private String str2;


and another one ..

To be able to instantiate the correct class at readtime, the classname must be transmitted. However in many cases both reader and writer know (at least most of) serialized classes at compile time. FST provides the possibility to register classes in advance, so only a number instead of a full classname is transmitted.
FSTConfiguration.getDefaultConfiguration().registerClass(BlogBenchAnnotated.class);


What's "Bulk"

Setup/Reuse of Streams actually require some nanoseconds, so by benchmarking just read/write of a tiny objects, a good part of per-object time is stream init. If an array of 10 BenchMark objects is written, per object time goes <300ns per object read/write.
Frequently an application will write more than one object into a single stream. For RPC encoding applications, a kind of "Batching" or just writing into the same stream calling "flush" after each object are able to actually get <300ns times in the real world. Of course Object Reference sharing must be turned off then (FSTConfiguration.setShared(false)).

For completeness: JDK (with manual Externalizable) Bulk yields 1197 nanos read and 378 nanos write, so it also profits from less initilaization. Unfortunately reuse of ObjectInput/OutputStream is not that easy to achieve mainly because ObjectOutputStream already writes some bytes into the underlying stream as it is instantiated.

Note that if (constant) initialization time is taken out of the benchmarks, the relative performance gains of FST are even higher (see benchmarks on fast serialization site).

Links:

Source of this Benchmark
FST Serialization Library (moved to github from gcode recently)


Wednesday, July 31, 2013

Impact of large primitive arrays (BLOBS) on Garbage Collection

While OldGen GC duration ("FullGC") depends on number of objects and the locality of their references to each other, young generation duration depends on the size of OldSpace memory. Alexej Ragozin has made extensive tests which give a good impression of young GC duration vs HeapSize here.

In order to avoid heavy impact of long lived data on OldGen GC, there are several workarounds/techniques.

  1. Put large parts of mostly static data Off-Heap using ByteBuffer.allocateDirect() or Unsafe.allocateMemory(). This memory is then used to store data (e.g. by using a fast serialization like http://code.google.com/p/fast-serialization/ [oops, I did it again] or specialized solutions like http://code.google.com/p/vanilla-java/wiki/HugeCollections ).
    Downside is, that one frequently has to implement a manual memory mangement on top.
  2. "instance saving" on heap by serializing into byte-arrays or transformation of datastructures. This usually involves using open adressed hashmaps without "Entry" Objects, large primitive arrays instead of small Objects like
    class ReferenceDataArray {
        int x[];
        double y[];
        long z[]; 
        public ReferenceDataArray(int size) {
             x = new int[size];
             y = new ...;
             z = ...;
        }
        public long getZ(int index) { return z[index]; }
    },
    replacement of generic collections with <Integer>, <Long> by specialized implementations with direct primitve int, long, ..
    If its worth to cripple your code this way is questionable, however the option exists.

Going the route outlined in (2) improves the effectivity of OldGen GC a lot. FullGC duration can be in the range of 2s even with heap sizes in the 8 GB area. CMS performs significantly better as it can scan OldSpace faster and therefore needs less headroom in order to avoid Full GC.

However there is still the fact, that YoungGen GC scales with OldSpace size.

The scaling effect is usually associated with "cardmarking". Young GC has to remember which areas of OldSpace have been modified (in such a way they reference objects in YoungGen). This is done with kind of a BitField where each bit (or byte) denotes the state of (modified/reference created or similar) a chunk ("card") of OldSpace.
Primitive Arrays basically are BLOBS for the VM, they cannot contain a reference to other Java Objects, so theoretically there is no need to scan or card-mark areas containing BLOBS them when doing GC. One could think e.g. of allocating large primitive arrays from top of oldspace, other objects from bottom this way reducing the amount of scanned cards.

Theory: blobs (primitive arrays) result in shorter young GC pauses then equal amount of heap allocated in smallish Objects.

Therefore I'd like to do a small test, measuring the effects of allocating large primitive arrays (such as byte[], int[], long[], double[]) on NewGen GC duration.

The Test

public class BlobTest {
    static ArrayList blobs = new ArrayList();
    static Object randomStuff[] = new Object[300000];
    public static void main( String arg[] ) {
        if ( Runtime.getRuntime().maxMemory() > 2*1024*1024*1024l) { // 'autodetect' avaiable blob space from mem settings
            int blobGB = (int) (Runtime.getRuntime().maxMemory()/(1024*1024*1024l));
            System.out.println("Allocating "+blobGB*32+" 32Mb blobs ... (="+blobGB+"Gb) ");
            for (int i = 0; i < blobGB*32; i++) {
                blobs.add(new byte[32*1024*1024]);
            }
            System.gc(); // force VM to adapt ..
        }
        // create eden collected tmps with a medium promotion rate (promotion rate can be adjusted by size of randomStuff[])
        while( true ) {
            randomStuff[((int) (Math.random() * randomStuff.length))] = new Rectangle();
        }
    }
}


The while loop at the bottom simulates the allocating application. Because I rewrite random indizes of the randomStuff arrays using a random index, a lot of temporary objects are created, because they same index is rewritten with another object instance. However because of random, some indices will not be hit in time and live longer, so they get promoted. The larger the array, the less likely index overwriting gets, the higher the promotion rate to OldSpace.

In order to avoid bias by VM-autoadjusting, I pin NewGen sizes, so the only variation is the allocation of large byte[] on top the allocation loop. (Note these settings are designed to encourage promotion, they are in now way optimal).


commandline:

java -Xms1g -Xmx1g -verbose:gc -XX:-UseAdaptiveSizePolicy -XX:SurvivorRatio=12 -XX:NewSize=100m -XX:MaxNewSize=100m -XX:MaxTenuringThreshold=2
by adding more GB the upper part of the test will use any heap above 1 GB to allocate byte[] arrays.

java -Xms3g -Xmx3g -verbose:gc -XX:-UseAdaptiveSizePolicy -XX:SurvivorRatio=12 -XX:NewSize=100m -XX:MaxNewSize=100m -XX:MaxTenuringThreshold=2
...
...
java -Xms11g -Xmx11g -verbose:gc -XX:-UseAdaptiveSizePolicy -XX:SurvivorRatio=12 -XX:NewSize=100m -XX:MaxNewSize=100m -XX:MaxTenuringThreshold=2

I am using byte[] arrays in the test, I verified int[], long[] behave exactly the same (must apply divisor then to adjust for larger size).


Results

(jdk 1.7_u21)


The 'Objects' test was done by replacing the static byte[] allocation loop in the benchmark by

            for ( int i = 0; i < blobGB*2700000; i++ )
                nonblobs.add(new Object[] {
                         new Rectangle(),new Rectangle(),new Rectangle(),
                         new Rectangle(),new Rectangle(),new Rectangle(),
                         new Rectangle(),new Rectangle(),new Rectangle(),
                         new Rectangle()});


Conclusion

Flattening data structures using on-heap allocated primitive arrays ('BLOBS') reduces OldGen GC overhead very effective. 
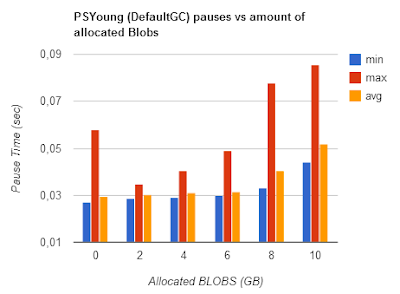
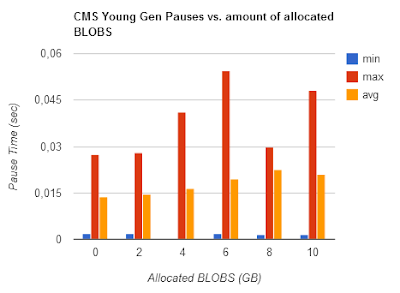
Young Gen pauses slightly reduce for CMS, so scaling with OldGen size is damped but not gone. For DefaultGC (PSYoung), minor pauses are actually slightly higher when the heap is filled with BLOBs.
I am not sure if the observed young gen duration variance has anything to do with "card marking" however i am satisfied quantifying effects of different allocation types and sizes :-) 

Further Improvement incoming ..


With this genious little optimization coming up in JDK 7_u40


card scanning of unmarked cards speeds up by a factor of 8. 

Additonally notice 

(for the test  -XX:+UnlockDiagnosticVMOptions -XX:ParGCCardsPerStrideChunk=512 gave the best results)
At least CMS Young Gen pause scaling is not too bad.

And G1 ?

G1 fails to execute the test. If one only allocates 6GB of byte[] with 11GB of heap, it still is much more disruptive than CMS. It works if I use small byte[] chunks of 1MB size and set page size to 32MB. Even then pauses are longer compared to CMS. G1 seems to have problems with large object arrays which will be problematic for IO intensive applications requiring big and many byte buffers.

Sunday, July 28, 2013

What drives Full GC duration ?

Its obvious that, the more memory allocated, the longer a full GC pause will be. However a GC has to track references, so I want to find out if primitve fields (like int, long) also increase Full GC duration. Additionally I'd like to find if the structure of an object graph has impact on GC duration.

The Test

I am creating a number of instances of the following classes:
    static class GCWrapper {
        GCWrapper(Object referenced) {
            this.referenced = referenced;
        }
        Object referenced;
    }
    static class GCWrapperMiddle {
        int a,b,c,d,e,f,g,h,i,j,k,l;
        GCWrapperMiddle(Object referenced) {
            this.referenced = referenced;
        }
        Object referenced;
    } 
    static class GCWrapperFat {
        int a,b,c,d,e,f,g,h,i,j,k,l;
        long aa,ab,ac,ad,ae,af,ag,ah,ai,jj,ak,al;
        GCWrapperFat(Object referenced) {
            this.referenced = referenced;
        }
        Object referenced;
    }
they all hold exactly one reference. But "Middle" and "Fat" additionally contain primitive fields, which increases their memory consumption a lot.
I am chaining those objects after creation to a linked list. For locality tests, the reference is pointed to a random other "GCWrapper" Object to create "far" references.
Additionally I am using the class below to test effects of "many references", a highly interlinked Object graph:
    static class GCWrapperLinked {
        GCWrapperLinked(Object referenced) {
            this.r1 = referenced;
        }
        Object r1,r2,r3,r4,r5;
    }
After instantiation, the test does 5 GC's using System.gc() and takes the last value (~3 calls are required until time stabilizes). 
Tests are done on an Intel i7 4 core 8 threads mobile processor with a somewhat outdated JDK 7 u 21, as I am in vacation currently with a pretty bad internet connection ...

What has more impact, Memory Size or Number of Object (-References) ?


The test was done with all collectors and different number of Objects on the Heap. Objects were allocated in  a linked List like
        GCWrapperMiddle res = new GCWrapperMiddle(null);
        for ( int i = 0; i < len; i++ ) {
            res = new GCWrapperMiddle(res);
        }
        return res;

The result shows clear linear dependency inbetween the number of Objects and Full GC duration.
Please don't conclude Default GC (ParOldGC) is slowest from the results, because
a) subsequent calls to system.gc() without mutation may enable Collectors to cut corners
b) they might choose to use fewer/more threads during collection

I test all Collectors just to ensure that observed interdependencies are present for all collectors.

Now let's compare effects of Object size on Full GC durations. As described above, I pumped up object size by adding int and long fields to them. Those fields cannot contain references to other objects (no need to scan them) but still consume space. The test creates 6 million objects of the classes shown above. Heap consumption is:

  • 163 Mb for 'small'
  • 427 Mb for 'middle'
  • 1003 Mb for 'large'
Now that's interesting:
Object size has a minor impact on Full GC duration (the differences observed can be attributed mostly to CPU cache misses, i assume). Main driver of FullGC duration is the number of object (-references). 


Does GC duration depend on number of objects or the number of object-references ?


To test this, I create an object graph where each gcwrapper object points to another randomly choosen gcwrapper object.
        GCWrapper res[] = new GCWrapper[len];
        for ( int i = 0; i < len; i++ ) {
            res[i] = new GCWrapper(null);
        }
        for ( int i = 0; i < len; i++ ) {
            res[i].referenced = res[((int) (Math.random() * len))];
        }
        return res;
and ('5 refs')
        GCWrapperLinked res[] = new GCWrapperLinked[len];
        for (int i = 0; i < res.length; i++) {
            res[i] = new GCWrapperLinked(null);
        }
        for (int i = 0; i < res.length; i++) {
            res[i].r1 = res[((int) (Math.random() * len))];
            res[i].r2 = res[((int) (Math.random() * len))];
            res[i].r3 = res[((int) (Math.random() * len))];
            res[i].r4 = res[((int) (Math.random() * len))];
            res[i].r5 = res[((int) (Math.random() * len))];
        }
        return res;


Oops, now that's surprising. It's strange, that DefaultGC (ParOldGC) actually gets faster for objects containing *more* references to (random) other objects !! This is not a test error and reproducable.
You probably now, that todays CPU's have a multi stage cache and that access to main memory is extremely expensive compared to cache hits, so locality (memory wise) is pretty important. Its obvious this also hit's Full GC when iterating the live set of objects.
(see http://www.akkadia.org/drepper/cpumemory.pdf for more information you'd probably want to read about caches ;-) ).

In contradiction to the CMS collector, ParOldGC ('DefaultGC') is able to compact the heap during Full GC. It seems it does this in a way optimizing the randomly linked object graph by moving objects close to objects referencing them (that's my speculative explanation, others are welcome ..).

This observation leads to the following test:
A comparion of FullGC of 6 million GCWrapper object graphs. One setup as linked list (linked in allocation order) and one with randomly choosen referenced objects.

        GCWrapper res = new GCWrapper(null);
        for ( int i = 0; i < len; i++ ) {
            res = new GCWrapper(res);
        }
        return res;
vs
        GCWrapper res[] = new GCWrapper[len];
        for ( int i = 0; i < len; i++ ) {
            res[i] = new GCWrapper(null);
        }
        for ( int i = 0; i < len; i++ ) {
            res[i].referenced = res[((int) (Math.random() * len))];
        }
        return res;
Boom ! The impact of locality is massive. This will also have a strong impact on performance of a java application accessing those data structures.

Conclusion:

Full GC duration depends on the number of objects allocated and the locality of their references. It does not depend that much on actual heap size.


Questionable design patterns regarding (OldGen) GC and overall locality


I think one can safely assume, that objects allocated at the same time have a high chance to be "near" each other (Note: CMS heap fragmentation may behave different if the application fragments the heap). So whenever statically allocated data is updated by refering to a newly allocated Object, chance is, that the new Object is far away from the referencee, which will cause cache misses. Especially the massive use of Immutables as favoured by many designs and (newer VM-based languages) actually is deadly regarding locality and OldGen GC.
  • Lazy initialization/instantiation
  • Value classes. E.g. GC-wise its better to use a primitive long instead of Date.
  • Immutables (except preallocated Flyweight's)
  • Fine grained class design 
  • Preferring Composition over Subclassing (many wrapper, delegate Objects)
  • JDK's HashMap uses entry objects. Use open addressed Hashmaps instead
  • Use of Long,Integer,Short instead of primitives in static data (unfortunately Java's Generics encourage this). Even if the VM does some optimization here (e.g. internal caching of Integer's), one can verify easily that these objects still have severe impact on GC duration

Sunday, July 7, 2013

Tuning and benchmarking Java 7's Garbage Collectors: Default, CMS and G1


[i am not a native english speaker, so enable quirks mode pls ...]

Due to trouble in a project with long GC pauses, I just had myself a deeper look into GC details. There is not that much acessible information/benchmarks on the Web, so I thought I might share my tests and enlightments ^^. Last time I tested GC some years ago I just came to the conclusion, that allocation of any form is evil in Java and avoided it as far as possible in my code.

I will not describe the exact algorithms here as there is plenty of material regarding this. Understanding the algorithms in detail does not necessary help on predicting actual behaviour in real systems, so I will do some tests and benchmarks.

The concepts of Garbage Collection in Hotspot are explained e.g. here.
In depth coverage of algorithms and parameters can be found here. I will cover GC from an empirical point of view here.

The basic idea of multi generational Garbage Collection is, to collect newer ("younger") Objects more frequent using a "minor" (short duration/pause) Collection algorithm. Objects which survived one or more minor collections then move to the "OldSpace". The OldSpace is garbage collected by the "major" Garbage Collector. I will name them NewSpace and NewGC, OldSpace and OldGC.

The NewGC Algorithm is pretty much the same amongst the 3 Garbage Collectors HotSpot provides. The Old Generation Collector ("OldGC") makes the difference.

  • In the Default Collector, OldSpace is cleaned up using a "Stop the World" Mark-Sweep.
  • The Concurrent Mark&Sweep Collector (CMS) uses (surprise!) a concurrent implementation of the Mark & Sweep Collection. This means the running application is not stopped during major GC. However it falls back to Stop-The-World GC if it can't keep up with applications allocation (promotion, tenuring) rate.
  • The G1 is also concurrent. It segments memory into equal chunks, trying to split the Garbage Collection Process into smaller pieces by collecting segments which are likely to contain a lot of garbage first. A more detailed description can be found here. It also falls back to Full-Stop-GC  in case it can't keep up with application allocation rate. However the duration of those Full-GC pauses are of shorter duration compared to the other OldSpace collectors.

Note that the term "parallel GC" refers to collection algorithms which run multithreaded, not necessary in parallel to your application.


The Benchmark


I wrote a small program which emulates most of the stuff Garbage Collectors have problems with:

  • 4GB of statically allocated Objects which are rarely freed.
    Problem for GC: with each major GC objects must be traversed, so the larger your reference data, cache's etc., the longer major GC will need for a full traversal collection.
  • A lot of temporary Object allocation of various size and age. "Age" refers to the amount of time the Object is referenced by the application.
  • Intentional partial replacements of pseudo-static data by new objects. This way I enforce "promotion" of objects to OldSpace, as they are long lived.
This is achieved by putting a lot of objects into a HashMap, then replace a fraction of it. Additionally the latency of a ~0,5 ms operation is measured and memorized to simulate processing of e.g. Requests. This way I get a distribution of VM/GC-related pauses. The benchmark runs for 5 minutes, so long term effects like heap fragmentation are not covered by the tests.

Note that this benchmark has an insane allocation rate and object age distribution. So results and VM tuning evaluated in this post illustrate the effects of some GC settings, its not cut & paste stuff, most of the sizings used to get this allocation greedy benchmark to work are way to big for real world applications.


Real men use default settings ..


Running the benchmark with -Xms8g -Xmx8g (the bench consumes 4g static, ~1g dynamic data) yields to quite disgusting results:

Each of the spikes represents a full GC with a duration of ~15 seconds ! During the full GC, the program is stopped. One can see, that the Garbage Collecor has some automatic calibration. Initially it did a pretty good job, but after first GC things get really bad.
I've noticed this in several tests. Most of the time the automatic calibration improves things, but sometimes it's vice versa (see Enlightment #2).

Hiccups ( [interval in milliseconds] => number of occurences ).
Iterations 9324, -Xmx8g -Xms8g 
[0] 4930
[1] 4366
[2] 8
[7] 1
[14000] 1
[15000] 10
[16000] 4
[17000] 3
[18000] 1
Read like e.g '4930' requests done in 0 ms, 10 requests had a response time of 15 seconds. Throughput was 9324 requests.

CMS did somewhat better, however there were also severe program-stopping GC's. Note the >10 times higher throughput.

Iterations 115726, ‐XX:+UseConcMarkSweepGC -Xmx8g -Xms8g
[0] 52348
[1] 62317
[2] 157
[46] 7
[61] 13
[62] 127
[63] 234
[64] 164
[65] 81
[66] 55
[67] 45
[68] 42
[69] 25
[70] 28
[71] 16
[72] 11
[73] 5
[74] 12
[14000] 7
[15000] 4
[17000] 1

G1 does the best job here (still 10 inacceptable full stop GC's..)
Iterations 110052
[0] 37681
[1] 67201
[2] 1981
[3] 725
[4] 465
[5] 306
[6] 217
[7] 182
[8] 113
[9] 105
[39] 13 
(skipped some intervals of minor occurence count)
[100] 288
[200] 23
[300] 6
[1000] 11
[12000] 5
[13000] 5
Hm .. pretty bad. Now, let's have a look into the GC internals:


If OldSpace (big green one) is full, the application gets a full-stop GC. In order to avoid Full GC, we need to reduce the promotion rate to OldSpace. An object gets promoted if it is alive (aka referenced) for a longer time than NewSpace (=Eden+Survivor Spaces) holds it.

So time for 

Finding #1: 
It is key to reduce the promotion rate from young gen to OldSpace. The promotion rate to OldSpace needs to be lowered in order to avoid Full-GC's. In case of concurrent OldSpace GC (CMS,G1), this will enable collectors to keep up with allocation rate.

Tuning the Young Generation


All 3 Collectors avaiable in Java 7 will profit of a proper NewGC setup.

Promotion happens if:
  • The "survivor space" (S0, S1) is full.
    The size of Survivor vs Eden is specified with the -XX:SurvivorRatio=N. A large Eden will increase throughput (usually) and will catch ultra-short lived temporary Objects better. However large Eden means small Survivor Spaces, so middle aged Objects might get promoted too quickly to OldSpace then, putting load on OldSpace GC.
  • Survivors have survived more than -XX:MaxTenuringThreshold=N (Default 15) minor collections. Unfortunately I did not find an option to give a lower bound for this value, so one can specify a maximum here only. -XX:InitialTenuringThreshold might help, however I found the VM will choose lower values anyway in case.


The following actions will reduce promotion (by encouraging survivors to live longer in young generation)
  • Decreasing -XX:SurvivorRatio=N to lower values than 8 (this actually increases the size of survivor spaces and decreases Eden size).
    Effect is that survivors will stay for a longer time in young gen (if there is sufficient size)
    This will reduce throughput as survivors are copied with each minor GC between S0,S1.
  • Increase the overall size of young generation with -XX:NewRatio=N.
    "1" means, young generation will use 50% of your heap, 2 means it will use 33% etc. A larger young gen reduces heap size for long-lived objects but will reduce the number of minor GCs and increase the size avaiable for survivors.
  • Increase -XX:MaxTenuringThreshold=N to values > 15.
    Of course this only reduces promotion, if the survivor space is large enough. Additonally this is only an upper bound, so the VM might choose a lower value regardless of your setting (you can also try 
    -XX:InitialTenuringThreshold). 
  • Increasing overall VM heap will help (in fact more GB always help :-) ), as this will  increase young generation (Eden+Survivor) and OldSpace size. An increase in OldSpace size reduces the number of required major GC's (or give concurrent OldSpace collectors more headroom to complete a major GC concurrent, pauseless).

It depends on the allocation behaviour of your application which of this actions will have effect.


Finding #2: 
When adjusting Survivor Ratio and/or MaxTenuringThreshold manually, always switch off auto adjustment with
 -XX:-UseAdaptiveSizePolicy


Below the effects of NewSpace settings on memory sizing. Note that the sizing of NewSpace directly reduces avaiable space in OldSpace  So if your application holds a lot of statically allocated data, increasing size of young generation might require you to increase overall memory size.


Note: In practice one would evaluate the required size of NewSpace and specify it with -XX:NewSize=X -XX:MaxNewSize=X absolutelyThis way changing -Xmx will affect OldSpace size only and will not mess up absolute Survivor Space sizes by applying ratios.

Actually the Default GC is the most useful collector to use in order to profile NewSpace setup, since there is no 2cnd background collector bluring OldSpace growth.

Survivor Sizing

The most important thing is, to figure out a good sizing (absolute, not ratio) for the survivor spaces and the promotion counter (MaxTenuringThreshold). Unfortunately there is a strong interaction between Eden size and MaxTenuringThreshold: If Eden is small, then Objects are put into survivor spaces faster, additional the tenuring counter is incremented more quickly. This means if Eden is doubled in size, you probably want to decrease your MaxTenuringThreshold and vice versa. This gets even more complicated as the number of Eden GC (=minor GC) also depends on application allocation rate.

The optimal survivor size is large enough to hold middle lived Objects under full application load without promoting them due to size shortage.

  • If survivor space is too large, its just a waste of memory which could be given to Eden instead. Additionally there is a correlation between survivor size and minor GC pauses (throughput degradation, jitter) [Fixme: to be proven].
  • If survivor space is too small, Objects will be promoted to OldSpace too early even if TenuringThreshold is not reached yet.

MaxTenuringThreshold

This defines how many minor GC's an Object may survive in SurvivorSpace before getting tenured to OldSpace. Again you have to optimize this under max application load, as without load there are fewer minor GC's so the "survived"-counters will be lower. Another issue to think of is that Eden size also affects the frequency of minor GC's. The VM will handle your value as an upper bound only and will automatically use lower values if it thinks these are more appropriate.

  • If MaxTenuringThreshold is too high, throughput might suffer, as non-temporary Objects will be subject to minor collection which slows down application. As said, the VM automatically corrects that.
  • If MaxTenuringThreshold is too low, temporary Objects might get promoted to OldSpace too early. This can hamper the OldSpace collector and increase the number of OldSpace GC's. If the promotion rate gets too high, even concurrent Collecors (CMS, G1) will do a full-stop-GC.

If in doubt, set MaxTenuringThreshold too high, this won't have a significant impact on application performance in practice.
It also strongly depends on the coding quality of the application: if you are the kind of guy preferring zero allocation programming, even a MaxTenuringThreshold=0 might be adequate (there is also kind of "alwaysTenure" option). The other extreme is "return new HashBuilder().computeHash(this);"-style (some alternative VM language produce lots of short to mid-lived temporary Garbage) where a settings like '30' or higher (which most often means: keep survivors as long there is room in SurvivorSpace) might be required.


Common sign of too slow promotion (MaxTenuringThreshold too high, Survivor size too high):
(-Xmx12g -Xms12g -XX:-UseAdaptiveSizePolicy -XX:SurvivorRatio=3 -XX:NewRatio=2 -XX:MaxTenuringThreshold=20)

bad survivor, TenuringThreshold setting

Initially it looks like there are no Objects promoted to OldSpace, as they actually "sit" in Survivor Space. Once the survivor spaces get filled, survivors are tenured to old Space resulting in a sudden increase of promotion rate. (5 minute chart of benchmark running with default GC, actually the application does not allocate more memory, it just constantly replaces small fractions of initially allocated pseudo-static Objects). This will probably confuse concurrent OldSpace Collectors, as they will start concurrent collection too late. Beware: Clever project manager's might bug you to look for memory leaks in your application or to plow through the logs to find out "what happened 14:36 when memory consumption all over a sudden starts to rise".

Same benchmark with better settings (-Xmx12g -Xms12g -XX:-UseAdaptiveSizePolicy -XX:SurvivorRatio=4 -XX:NewSize=4g -XX:MaxNewSize=4g -XX:MaxTenuringThreshold=15):

better survivor, TenuringThreshold setting

The promotion rate now reflects the actual allocation rate of long-lived objects. Since there is no concurrent OldSpace Collector in the default GC, it looks like a permanent growth.  Once the limit is reached, a Full-GC will be triggered and will clean up unused long lived Objects. A concurrent collector like CMS, G1 will now be able to detect promotion rate and keep up with it.

Eden Size

Eden Size directly correlates with throughput as most java applications will create a lot of temporary objects.

as measured with high allocation rate application


Eden size: red: 642MB, blue: 1,88GB, yellow: 3,13GB, green: 4,39GB

As one can see, Eden size correlates with number, not the length of minor collections.

Settings used for benchmark (Survivor spaces are kept constant, only Eden is enlarged):

-XX:-UseAdaptiveSizePolicy -XX:SurvivorRatio=1 -XX:NewSize=1926m -XX:MaxNewSize=1926m -XX:MaxTenuringThreshold=40
= 642m Eden

-XX:-UseAdaptiveSizePolicy -XX:SurvivorRatio=3 -XX:NewSize=3210m -XX:MaxNewSize=3210m -XX:MaxTenuringThreshold=15
= 1,88g Eden

-XX:-UseAdaptiveSizePolicy -XX:SurvivorRatio=5 -XX:NewSize=4494m -XX:MaxNewSize=4494m -XX:MaxTenuringThreshold=12
= 3,13g Eden

-XX:-UseAdaptiveSizePolicy -XX:SurvivorRatio=7 -XX:NewSize=5778m -XX:MaxNewSize=5778m -XX:MaxTenuringThreshold=8
= 4,39g Eden (heap size 14Gb required)


Finding #3:
  • Eden size strongly correlates with throughput/performance for common java applications (with common allocation patterns). The difference can be massive.
  • Eden size, Allocation rate, Survivor size and TenuringThreshold are interdependent. If one of those factors is modified, the others need readjustment
  • Ratio-based options can be dangerous and lead to false assumptions. NewSpace size should be specified using absolute settings (-XX:NewSize=)
  • Wrong sizing can lead to strange allocation and memory consumption patterns 

Tuning OldSpace Garbage Collectors


Default GC


Default GC has a Full-Stop-GC (>15 seconds with the benchmark), so there is not much to do. If you want to run your application with Default GC (e.g. because of high throughput requirements), your only choice is to tune NewSpace GC very agressively, then throw tons of Heap to your application in order to avoid Full-GC during the day. If your system is 24x7 consider triggering a full GC using System.gc() at night if you expect the system load to be low.
Another possibility would be to even size the VM bigger than your physical RAM, so tenured Objects are written to swap disk. However you have to be sure then no Full-GC is triggered ever, because duration of Full-GC will go into the minutes then. I have not tried this.
Ofc one can improve things always by coding less memory intensive, however this is not the topic of this post.

Concurrent Mark & Sweep (CMS)


The CMS Collector does a pretty good job as long your promotion rate is not too high (which should not be the case if you optimized that as described above).
One Key setting of CMS Collector is, when to trigger a concurrent full GC. If it is triggered too late, it might not be able to finish in time and a Full-Stop-GC will happen. If you know your application has like 30% statically allocated data you might want to set this to 30% like -XX:+UseCMSInitiatingOccupancyOnly
-XX:CMSInitiatingOccupancyFraction=30. In practice I always start with a value of 0, then experiment with higher values once everything (NewSpace, OldSpace) is calibrated to operate without triggering FullGC under load.

When i copy the settings evaluated in the "NewGen Tuning" settings straight forward, the result will be a permanent Full-GC. Why ?
Because CMS requires more heap than the default GC. It seems like the same data structures just require ~20-30% more memory. So we just have to multiply NewGC settings evaluated from Default GC with 1.3.
Additionally, a good start is to let the concurrent Mark & Sweep run all the time.

So I go with (copied 2cnd NewSpace config from above and multiplied):

‐XX:+UseConcMarkSweepGC -XX:+UseCMSInitiatingOccupancyOnly
-XX:CMSInitiatingOccupancyFraction=10 -Xmx12g -Xms12g -XX:-UseAdaptiveSizePolicy
-XX:SurvivorRatio=3 -XX:NewSize=4173m -XX:MaxNewSize=4173m
-XX:MaxTenuringThreshold=15

The CMS is barely able to keep up with promotion rate, throughput is 300.000 which is acceptable given that cost of (in contradiction to tests above) Full-GC is included.

CMS OldSpace collection can keep up with promotion rate barely

We can see from Visual GC (an excellent jVisualVM plugin), that OldSpace size is on the edge of triggering a full GC. In order to improve throughput, we would like to increase eden. Unfortunately there is not enough  headroom in OldSpace, as a reduction of OldSpace would trigger Full-Stop-GC's.
Reducing the size of Surviver Spaces is not an option, as this would result in a higher tenured Object rate and again trigger Full GC's. The only solution is: More Memory.
Comparing throughput with the Default GC test above is not fair, as the Default GC would run into Full-Stop-GC's for sure, if the test would run for a longer time than 5 minutes.
On a side note: the memory chart of jVisual VM's (and printouts by -verbose:gc) does not tell you the full story as you cannot see the fraction of used memory in OldSpace.

Ok, so lets add 2 more Gb to be able to increase eden resulting in

-XX:+UseConcMarkSweepGC -XX:+UseCMSInitiatingOccupancyOnly
-XX:CMSInitiatingOccupancyFraction=10 -Xmx14g -Xms14g -XX:-UseAdaptiveSizePolicy
-XX:SurvivorRatio=4 -XX:NewSize=5004m -XX:MaxNewSize=5004m
-XX:MaxTenuringThreshold=15


(Eden size is 3,25 GB).
This increases throughput by 10% to 330.000.

blue is Heap 12g, Eden 2,4g, red  is Heap 14g, Eden 3,2g

The longest pause noted in processing were 400ms. Exact Reponse time distribution:

-XX:+UseConcMarkSweepGC
-XX:+UseCMSInitiatingOccupancyOnly -XX:CMSInitiatingOccupancyFraction=10
-Xmx14g -Xms14g
-XX:-UseAdaptiveSizePolicy
-XX:SurvivorRatio=4 -XX:NewSize=5004m -XX:MaxNewSize=5004m
-XX:MaxTenuringThreshold=15

Iterations 327175

[0] 146321
[1] 179968
[2] 432
[3] 33
[14] 1
[70] 2
[82] 1
[83] 1
[85] 2
[87] 1
[100] 3
[200] 355
[300] 44
[400] 11


Finding #4:
  • Eden size still correlates with throughput for CMS
  • Compared with the Default Hotspot GC all NewGen sizes must be multiplied by 1.3
  • CMS also requires 20%-30% more Heap for identical data structures
  • No Full-Stop-GCs at all if you can provide the necessary amount of memory (large NewSpace + HeadRoom in OldSpace)

The G1 Collector


The G1 collector is different. Each segment of G1 has its own NewSpace, so absolute values set with -XX:NewSize=5004m -XX:MaxNewSize=5004m are actually ignored (don't ask me how long i fiddled with G1 and the NewSize parameters until I got this). Additionally VisualGC does not work for G1 Collector.
Anyway, we still know that the benchmark succeeds in being one of the most greedy java programs out there, so ..
  • we like large survivor spaces and a large NewSpace to reduce promotion to OldSpace
  • we like large Eden to trade memory efficiency against throughput. Memory is cheap.
Unfortunately not much is known about the efficiency of the G1 OldSpace collector, so the only possibility is testing. If the G1 OldSpace collector is more efficient than CMS OldSpace collector, we could decrease survivor space in favour of bigger eden spaces, because with a potentially more efficient G1 OldSpace collector, we may afford a higher promotion rate.

Here we go:

-Xmx12g -Xms12g -XX:+UseG1GC -XX:-UseAdaptiveSizePolicy -XX:SurvivorRatio=1 -XX:NewRatio=1 -XX:MaxTenuringThreshold=15 
yields:
Iterations 249372
(values < 100ms skipped)
[100] 10
[200] 1
[400] 4
[500] 198
[600] 15
[700] 1

well, that's pretty good as first effort. Lets try to increase decrease survivors and start concurrent G1 earlier ..

-Xmx12g -Xms12g -XX:+UseG1GC -XX:-UseAdaptiveSizePolicy -XX:SurvivorRatio=2 -XX:NewRatio=1 -XX:MaxTenuringThreshold=15 -XX:InitiatingHeapOccupancyPercent=0

Iterations 233262
[100] 3
[200] 1
[400] 81
[500] 96
[600] 3
[700] 5
[800] 2
[1000] 18


err .. nope. We can see that decreasing survivor space puts more load on G1 OldSpace GC as the number of 1 second area pauses increased significantly. Just another blind shot relaxing survivors and increase G1 OldSpace load ..

-Xmx12g -Xms12g -XX:+UseG1GC -XX:-UseAdaptiveSizePolicy -XX:SurvivorRatio=6 -XX:NewRatio=1 -XX:MaxTenuringThreshold=15 -XX:InitiatingHeapOccupancyPercent=0


Iterations 253293
[100] 5
[200] 1
[400] 186
[500] 2
[600] 9
[700] 5
[1000] 16

same throughput as intial trial, but larger pauses .. so I still need to look for large survivor and eden space. The only way to influence absolute NewSpace size is changing segment size (I take max size ofc).

-Xmx12g -Xms12g -XX:+UseG1GC -XX:-UseAdaptiveSizePolicy -XX:SurvivorRatio=1 -XX:NewRatio=1 -XX:MaxTenuringThreshold=15 -XX:G1HeapRegionSize=32m


Iterations 275464
[100] 37
[300] 1
[400] 5
[500] 189
[600] 16
[900] 1

Bingo ! Unfortunately all known tuning options are exploited now .. except main Heap size ..


-Xmx14g -Xms14g -XX:+UseG1GC -XX:SurvivorRatio=1 -XX:NewRatio=1 -XX:MaxTenuringThreshold=15 -XX:-UseAdaptiveSizePolicy -XX:G1HeapRegionSize=32m

Iterations 296270
[100] 58
[200] 3
[300] 2
[400] 4
[500] 160
[600] 15
[700] 11


This is slightly worse in latency and througput than a proper configured CMS. One last shot in order to figure out behaviour regarding memory size constraints (at least real peak size of the bench is round 4.5g ... sigh):

-Xmx8g -Xms8g -XX:+UseG1GC -XX:SurvivorRatio=1 -XX:NewRatio=2 -XX:MaxTenuringThreshold=15 -XX:-UseAdaptiveSizePolicy -XX:G1HeapRegionSize=32m

Iterations 167721
[100] 37
[200] 1
[300] 3
[400] 297
[500] 7
[600] 9
[700] 5
[1000] 15
[2000] 1


It seems G1 excels in memory efficiency without having to do too long pauses (CMS falls into permanent full GC if I try to run the bench with 8g heap). This can be important in memory constrained server environments and at client side. 


Finding #5:
  • Absolute settings for NewSpace size are ignored by G1. Only the ratio based options are acknowledged.
  • In order to influence eden/survivor space, one can increase/decreas segment size up to 32m. This also gave best throughput (possibly because of larger eden)
  • G1 can handle memory constraints the best without extremely long pauses
  • Latency distribution is ok, but behind CMS

Conclusion

Disclaimer: 

  • The benchmark used is worst case ever regarding allocation rate and memory waste. So take any finding with a grain of salt, when applying GC optimizations to your program.
  • I did not drive long term tests. All tests ran for 5 minutes only. Due to the extreme allocation rate of the benchmark, 5 minute benchmark is likely aequivalent to an hour operation of a "real" program. Anyway in an application with lower allocation rate, concurrent collectors will have more time to complete GC's concurrent, so you probably never will need an eden size of 4Gb in practice :).
    I will provide long term runs in a separate post (maybe :) ).


Default GC (Serial Mark&Sweep, Serial NewGC) shows highest throughput as long no Full GC is triggered.
If your system has to run for a limited amount of time (like 12 hours) and you are willing to invest into a very careful programming style regarding allocation; keep large datasets Off-Heap, DefaultGC can be the best choice. Of course there are applications which are ok with some long GC pauses here and there.

CMS does best in pause-free low latency operation as long you are willing to throw memory at it. Throughput is pretty good. Unfortunately it does not compact the heap, so fragmentation can be an issue over time. This is not covered here as it would require to run real application tests with many different Object sizes for several days. CMS is still way behind commercial low-latency solutions such as Azul's Zing VM.

G1 excels in robustness, memory efficiency with acceptable throughput. While CMS and DefaultGC react to OldSpace overflow with Full-Stop-GC of several seconds up to minutes (depends on Heap size and Object graph complexity), G1 is more robust in handling those situations. Taking into account the benchmark represents a worst case scenario in allocation rate and programming style, the results are encouraging.


Blue:CMS, Red: Default GC, Yellow: G1

Note: G1 has the lowest number of pauses. (Default GC has been tweaked to not do >15 second Full GC during test duration)
Default GC has been tweaked to not Full GC during test duration


The Benchmark source

public class FSTGCMark {

    static class UseLessWrapper {
        Object wrapped;
        UseLessWrapper(Object wrapped) {
            this.wrapped = wrapped;
        }
    }

    static HashMap map = new HashMap();
    static int hmFillRange = 1000000 * 30; //
    static int mutatingRange = 2000000; //
    static int operationStep = 1000;

    int operCount;
    int milliDelayCount[] = new int[100];
    int hundredMilliDelayCount[] = new int[100];
    int secondDelayCount[] = new int[100];
    Random rand = new Random(1000);

    int stepCount = 0;
    public void operateStep() {
        stepCount++;

        if ( stepCount%100 == 0 ) {
            // enforce some tenuring
            for ( int i = 0; i < operationStep; i++) {
                int key = (int) (rand.nextDouble() * mutatingRange)+mutatingRange;
                map.put(key,  new UseLessWrapper(new UseLessWrapper(""+stepCount)));
            }
        }
        if ( stepCount%200 == 199 ) {
            // enforce some tenuring
            for ( int i = 0; i < operationStep; i++) {
                int key = (int) (rand.nextDouble() * mutatingRange)+mutatingRange*2;
                map.put(key,  new UseLessWrapper(new UseLessWrapper("a"+stepCount)));
            }
        }
        if ( stepCount%400 == 299 ) {
            // enforce some tenuring
            for ( int i = 0; i < operationStep; i++) {
                int key = (int) (rand.nextDouble() * mutatingRange)+mutatingRange*3;
                map.put(key,  new UseLessWrapper(new UseLessWrapper("a"+stepCount)));
            }
        }
        if ( stepCount%1000 == 999 ) {
            // enforce some tenuring
            for ( int i = 0; i < operationStep; i++) {
                int key = (int) (rand.nextDouble() * hmFillRange);
                map.put(key,  new UseLessWrapper(new UseLessWrapper("a"+stepCount)));
            }
        }
        for ( int i = 0; i < operationStep/2; i++) {
            int key = (int) (rand.nextDouble() * mutatingRange);
            map.put(key, new UseLessWrapper(new Dimension(key,key)));
        }
        for ( int i = 0; i < operationStep/8; i++) {
            int key = (int) (rand.nextDouble() * mutatingRange);
            map.put(key, new UseLessWrapper(new UseLessWrapper(new UseLessWrapper(new UseLessWrapper(new UseLessWrapper("pok"+i))))));
        }
        for ( int i = 0; i < operationStep/16; i++) {
            int key = (int) (rand.nextDouble() * mutatingRange);
            map.put(key, new UseLessWrapper(new int[50]));
        }
        for ( int i = 0; i < operationStep/32; i++) {
            int key = (int) (rand.nextDouble() * mutatingRange);
            map.put(key, ""+new UseLessWrapper(new int[100]));
        }
        for ( int i = 0; i < operationStep/32; i++) {
            int key = (int) (rand.nextDouble() * mutatingRange);
            Object[] wrapped = new Object[100];
            for (int j = 0; j < wrapped.length; j++) {
                wrapped[j] = ""+j;
            }
            map.put(key, new UseLessWrapper(wrapped));
        }
        for ( int i = 0; i < operationStep/64; i++) {
            int key = (int) (rand.nextDouble() * mutatingRange /64);
            map.put(key, new UseLessWrapper(new int[1000]));
        }
        for ( int i = 0; i < 4; i++) {
            int key = (int) (rand.nextDouble() * 16);
            map.put(key, new UseLessWrapper(new byte[1000000]));
        }
    }

    public void fillMap() {
        for ( int i = 0; i < hmFillRange; i++) {
            map.put(i, new UseLessWrapper(new UseLessWrapper(""+i)));
        }
    }

    public void run() {
        fillMap();
        System.gc();
        System.out.println("static alloc " + (Runtime.getRuntime().totalMemory() - Runtime.getRuntime().freeMemory()) / 1000 / 1000 + "mb");
        long time = System.currentTimeMillis();
        int count = 0;
        while ( (System.currentTimeMillis()-time) < runtime) {
            count++;
            long tim = System.currentTimeMillis();
            operateStep();
            int dur = (int) (System.currentTimeMillis()-tim);
            if ( dur < 100 )
                milliDelayCount[dur]++;
            else if ( dur < 10*100 )
                hundredMilliDelayCount[dur/100]++;
            else {
                secondDelayCount[dur/1000]++;
            }
        }
        System.out.println("Iterations "+count);
    }

    public void dumpResult() {
        for (int i = 0; i < milliDelayCount.length; i++) {
            int i1 = milliDelayCount[i];
            if ( i1 > 0 ) {
                System.out.println("["+i+"]\t"+i1);
            }
        }
        for (int i = 0; i < hundredMilliDelayCount.length; i++) {
            int i1 = hundredMilliDelayCount[i];
            if ( i1 > 0 ) {
                System.out.println("["+i*100+"]\t"+i1);
            }
        }
        for (int i = 0; i < secondDelayCount.length; i++) {
            int i1 = secondDelayCount[i];
            if ( i1 > 0 ) {
                System.out.println("["+i*1000+"]\t"+i1);
            }
        }
    }
    int runtime = 60000 * 5;
    public static void main( String arg[] ) {
        FSTGCMark fstgcMark = new FSTGCMark();
        fstgcMark.run();
        fstgcMark.dumpResult();
    }
}